
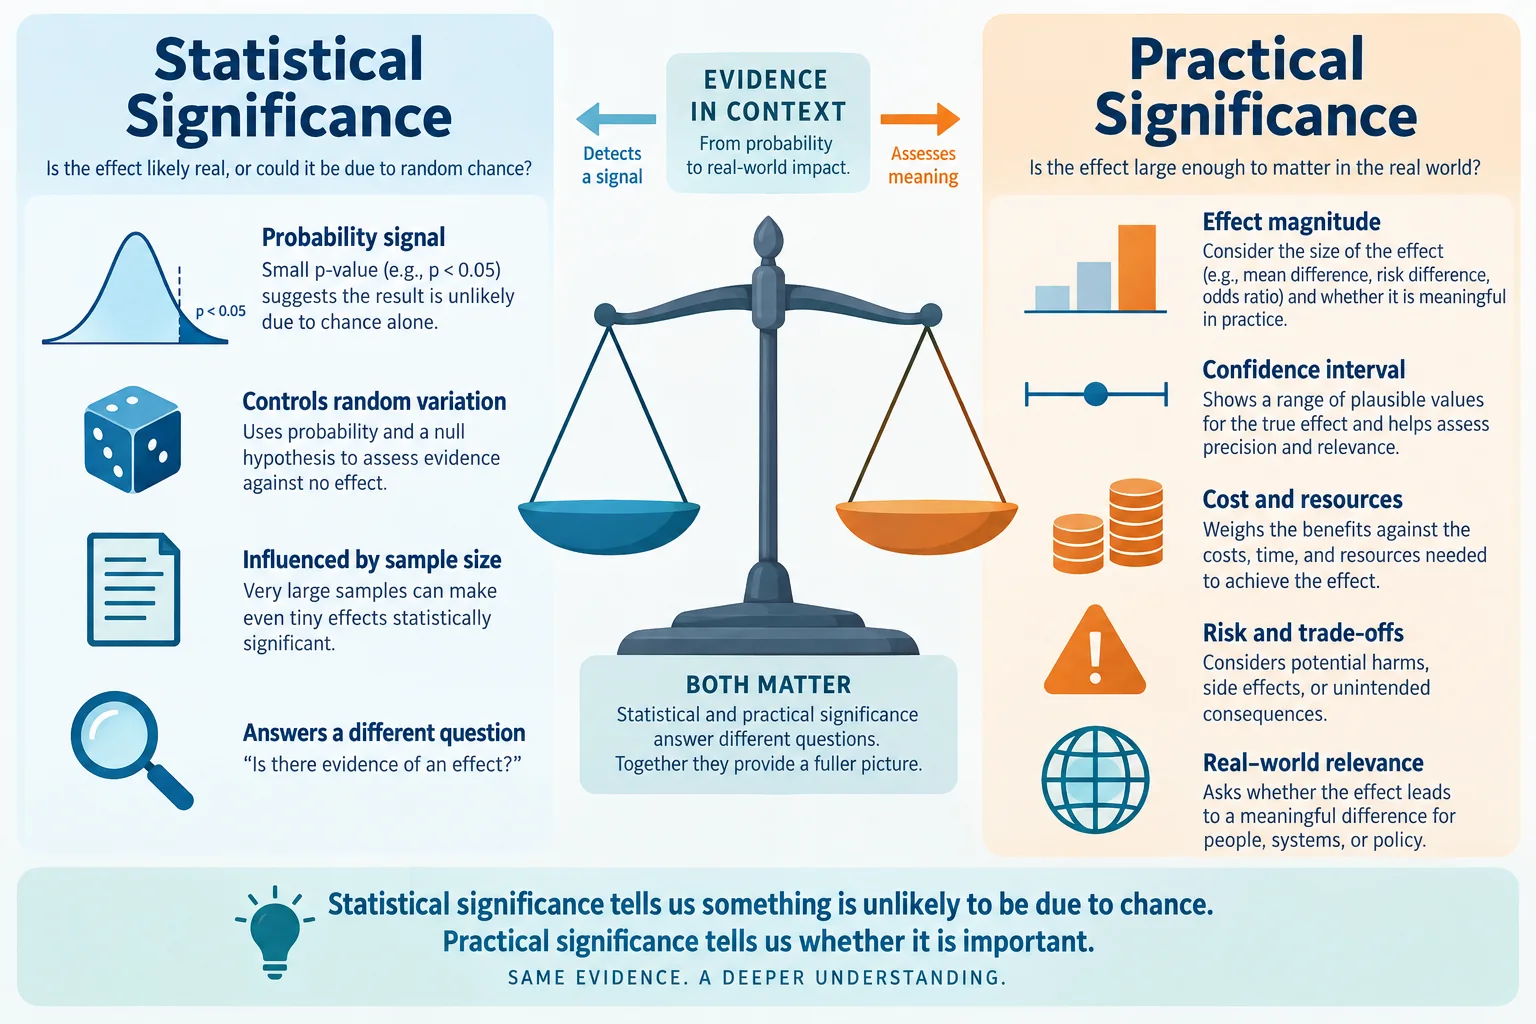
The two terms answer different questions
A p-value does not measure the probability that a hypothesis is true, the size of an effect, or the chance that a result will replicate. It summarizes how incompatible the observed data are with a specified statistical model, often one assuming no difference. The familiar threshold of p below 0.05 is a convention, not a border between truth and falsehood.
Practical significance examines magnitude and consequences. A supplement might produce a statistically detectable average difference that is too small to notice, requires months of perfect adherence, costs more than the benefit is worth, or adds sleep and cardiovascular concerns. Conversely, an imprecise study may miss a potentially useful effect because it enrolled too few participants.
Why sample size changes the story
Large studies can make tiny differences statistically significant because estimates become more precise. Small studies can produce dramatic point estimates with wide confidence intervals and still fail to cross an arbitrary threshold. Neither situation is interpreted well by asking only whether p is below 0.05.
Check the number randomized, number analyzed, attrition by group, and whether the sample-size calculation was based on a meaningful primary outcome. A “non-significant” result does not prove equivalence unless the study was designed and powered to test an appropriate equivalence or noninferiority margin.
Numbers that matter more than a star beside p
- Absolute between-group difference. How much more did the intervention change the outcome than the comparison?
- Confidence interval. What range of effects remains compatible with the data?
- Baseline risk or value. Relative changes can look large when absolute changes are small.
- Duration. Was the difference measured for hours, weeks, or months?
- Adverse events and dropout. Did harms or burden undermine usefulness?
- Prespecification. Was this the primary outcome or one of many analyses?
Also ask who the participants were. A meaningful result in one tightly defined group may not generalize to people with different ages, health conditions, diets, caffeine exposure, or medicines.
Worked example: significant but not persuasive
Suppose a large trial finds that a supplement group loses an average of 0.3 kg more than placebo after twelve weeks, with p below 0.05. The statistical result suggests the observed difference is not easily dismissed as random variation under the model. It does not decide whether 0.3 kg is noticeable, durable, worth the price, or worth more insomnia.
Now add a confidence interval from 0.05 to 0.55 kg, substantial dropout, and no follow-up after treatment. The correct conclusion is narrower than “proven effective.” A reader can acknowledge a detectable average difference while deciding it lacks practical value.
Use an effect-to-decision worksheet
Record the outcome unit, absolute difference, confidence interval, duration, comparator, attrition, adverse events, cost, and your minimum worthwhile effect. The minimum should be chosen for the decision, not moved after seeing the result. If no meaningful threshold exists, explain the magnitude in concrete terms rather than declaring it important.
Beware of multiple outcomes and selective emphasis
When researchers test many outcomes, time points, subgroups, and models, some may cross p below 0.05 by chance. Preregistration and a clearly identified primary outcome help readers distinguish confirmatory analysis from exploration. Corrections for multiple comparisons may be appropriate, but they do not repair every design or reporting problem.
Read the trial registry or protocol when possible. Compare planned outcomes with the paper. If the abstract highlights a secondary result while the primary outcome was null, the headline may exaggerate the evidence even when every displayed number is technically correct.
Read confidence intervals as a range of plausible effects
A point estimate is the study’s single best estimate under its model; the confidence interval shows the surrounding uncertainty. A narrow interval around a tiny benefit can support the conclusion that the average effect is probably small. A wide interval crossing no difference may contain both a worthwhile benefit and no useful effect. Calling the second result simply “negative” throws away important information.
Interpret the interval in the outcome’s real unit whenever possible. Kilograms, centimeters, calories, adverse events, and dropout percentages are easier to judge than standardized effects alone. Compare both ends with a prespecified worthwhile threshold. If the entire interval falls below that threshold, the finding may be precise yet practically unimportant. If it spans benefit and harm, the decision remains uncertain.
Precision is not validity. A narrow confidence interval cannot repair biased allocation, an inappropriate comparator, selective reporting, poor adherence measurement, or a mismatch between the studied ingredient and the marketed formula. Practical interpretation requires both trustworthy design and decision-relevant numbers.
Set the decision threshold before the result
A practical threshold should reflect the alternatives. A very small benefit may be reasonable for a low-cost, low-burden intervention, yet unattractive for a stimulant that disrupts sleep or interacts with medicines. Consider the entire package: expected magnitude, uncertainty, time, money, adherence burden, adverse effects, and what else could achieve the same goal.
Avoid inventing a universal cutoff for every reader. Instead, state the observed effect clearly and show how the decision changes under reasonable priorities. This keeps the evidence separate from personal values while still helping a reader act.
Apply practical significance to a supplement decision
Our guide to clinically meaningful effects in weight-loss research extends this framework. Then use the Fat Burn Active evidence audit to see why ingredient-level statistical findings cannot be added into a product promise.
The official Fat Burn Active page lists a multi-ingredient thermogenic formula, but the buying decision for Statistical Significance vs Practical Significance should follow the evidence check above. Compare our independent review, then, if the product remains a reasonable fit, verify the current label, directions, and purchase options. We may receive a commission at no additional cost.
Frequently asked questions
Does p below 0.05 prove a supplement works?
No. It does not measure effect size, certainty of the hypothesis, practical value, or product-level effectiveness.
Is a non-significant result proof of no effect?
No. The estimate and confidence interval may still include useful or harmful effects.
What should I read first?
The absolute between-group effect and confidence interval, followed by design, duration, attrition, and harms.
Who decides what is practically meaningful?
The threshold depends on the outcome, alternatives, burden, cost, risk, and the user’s goals; it should be stated transparently.
Practical decision checkpoint
Imagine two groups whose average weight change differs by a small amount after several weeks. A low p-value can indicate that the observed difference is unlikely under a particular statistical model; it does not tell a buyer whether the change is large enough to notice or sustain. Write down the absolute difference, follow-up period, uncertainty interval, and how many people stopped participating. Then compare the result with cost, effort, and adverse effects. A practical decision needs the size and reliability of the benefit, not a significance label alone.
Sources
- American Statistical Association: Statement on Statistical Significance and P-Values
- American Statistical Association: Moving to a World Beyond p < 0.05
- CONSORT reporting guideline
- EQUATOR Network: Reporting Guidelines
- NIH ODS: Dietary Supplements for Weight Loss
Sources reviewed September 18, 2026. This article provides general educational information and does not replace medical advice.